Loading
Back to Expertise
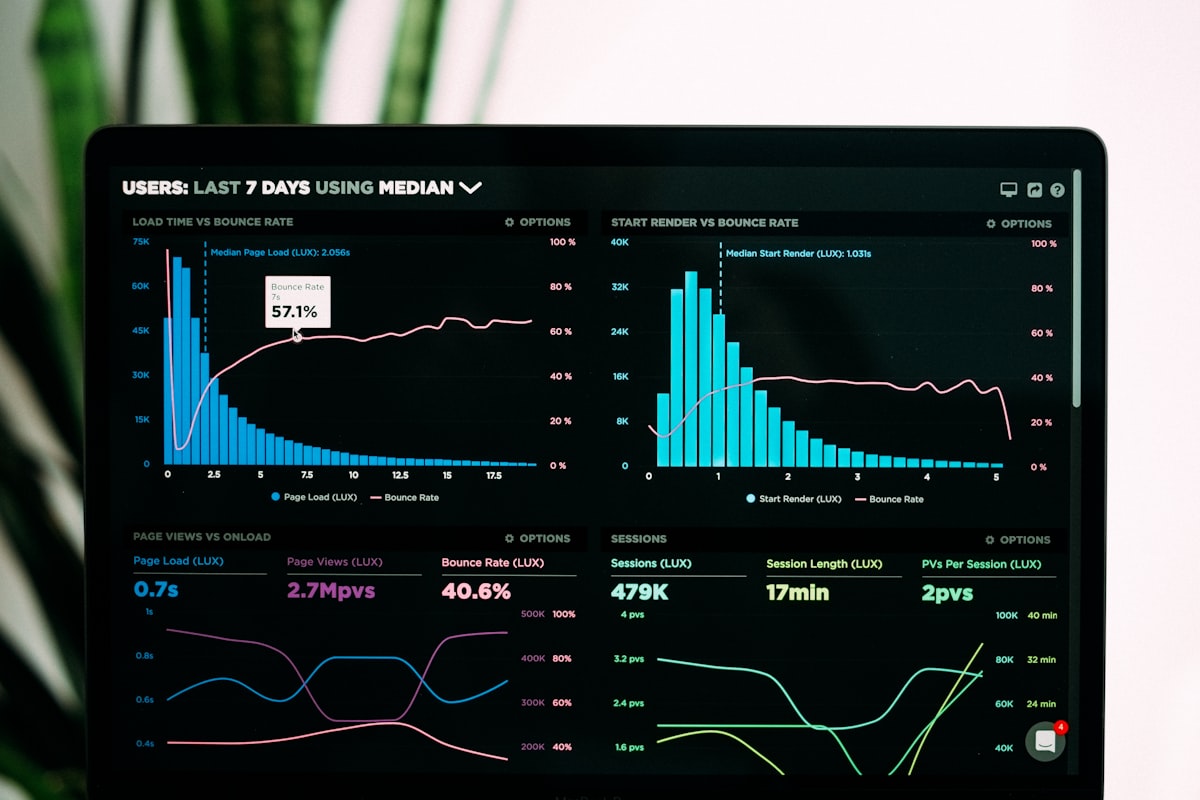
System Monitoring
Real-time visibility, metric collection, and alert generation for your IT stack.
1B+
Daily Data Points
<30s
Alert Trigger Time
10K+
Monitored Endpoints
You cannot secure or scale what you cannot see. Our monitoring architectures ingest billions of data points daily, transforming raw server metrics into actionable, beautiful, and intuitive Grafana dashboards.
Key Benefits
1
Grafana Visualization
Building highly customized, stunning dashboards that aggregate data from multiple disparate sources.
2
Zabbix Infrastructure Monitoring
Deploying robust Zabbix proxies and server clusters to monitor thousands of nodes securely.
3
Proactive Alerting
Routing critical alerts through intelligent escalation rules to ensure the right engineers are notified instantly.
What is System Monitoring?
System monitoring involves collecting metrics, real-time analysis, alert generation, and visibility of IT components. We specialize in deploying top-tier open-source monitoring solutions, including Grafana and Zabbix, to guarantee complete observability of your complex networks.
Development Process
Architecture Design
Strategizing metrics collection via Push (Telegraf/StatsD) or Pull (Prometheus EXporters) methodologies.
Zabbix Proxy Topologies
Deploying distributed Zabbix architectures for massive multi-datacenter environments.
Custom Grafana Panels
Writing complex PromQL/SQL queries to extract precise business insights from raw system data.
Incident Routing
Connecting alert managers (like PagerDuty or Slack) to severity-based metric thresholds.
Technology Stack
Grafana
The open observability platform for monitoring, visualizing metrics, logs, and traces.
Zabbix
Enterprise-class open source distributed monitoring solution for networks and applications.
Prometheus
Open-source systems monitoring and alerting toolkit built for dynamically managed environments.
Telegraf
Plugin-driven server agent for collecting and reporting metrics from databases, systems, and IoT.
InfluxDB
Purpose-built time series database for real-time analytics and monitoring metrics.
Loki
Horizontally-scalable, highly-available, multi-tenant log aggregation system.
AlertManager
PagerDuty
SNMP
StatsD
Monitoring & Observability Pipeline
The complete data flow from application metrics and infrastructure telemetry through collection agents, into time-series databases, and finally rendered on Grafana dashboards with real-time alerting.
Technical Deep Dives
Building a Unified Observability Stack
Most organizations run monitoring in silos: one tool for servers, another for applications, yet another for network devices. This fragmentation means that when an incident occurs, engineers waste precious minutes correlating data across disconnected dashboards.
Our approach unifies everything into a single Grafana instance. Prometheus scrapes application metrics (HTTP latency, error rates, queue depths). Zabbix monitors infrastructure health (CPU, memory, disk I/O, SNMP traps from network switches). Loki aggregates application logs with the same label structure as Prometheus metrics.
The magic is in correlation. When an application's error rate spikes, engineers can pivot instantly to infrastructure metrics for the same time window and the same host, then drill into the exact log lines showing the root cause — all from a single dashboard. This reduces Mean Time to Resolution (MTTR) from hours to minutes.
Why Choose Us?
- High-Volume Data ExpertsWe understand how to tune time-series databases to handle insane write loads without dropping packets.
- Holistic VisibilityWe correlate seemingly unrelated events (e.g., an application error rate spike matching an OS-level IO wait increase).
Frequently Asked Questions
SaaS tools charge massive premiums based on metric volume and host count. By self-hosting Grafana/Zabbix, your costs remain flat regardless of how much data you ingest or how many servers you add.
Yes, we can write custom exporters or use Zabbix agent capabilities to scrape metrics from virtually any system, old or new.
We implement intelligent alert routing with severity-based escalation, deduplication, and maintenance windows. Only actionable alerts reach engineers, reducing noise by up to 90%.
Yes. We deploy kube-state-metrics, node-exporter, and cAdvisor to provide deep visibility into pod health, resource consumption, and cluster capacity planning.
Absolutely. We deploy Zabbix proxies and Prometheus federation to aggregate metrics from multiple geographic locations into a single central dashboard.
Conclusion
Move from reactive firefighting to proactive optimization. IQAAI Technologies builds the sensory nervous system for your infrastructure.
Related Expertise
Container Management and Orchestration
Automating the lifecycle of applications encapsulated in containers.
Explore CapabilityConsulting and expertise in open source infrastructure
Strategic support around auditable, open-source infrastructure solutions.
Explore CapabilityTelephony & VoIP Solutions at Scale
Enterprise-grade VoIP, bidirectional streaming, and AI integrations leveraging FreeSWITCH, Asterisk, and Vicidial.
Explore CapabilityReady to Get Started?
Schedule a free consultation with our engineers to discuss your system monitoring requirements.